Conclusion
Last updated on 2025-01-23 | Edit this page
Overview
Questions
- How can I apply what I have learned in this lesson?
- In which areas can I further expand my knowledge based on what I have learned?
Objectives
- Review the possibilities of data visualization for statistical inference and storytelling in humanities research.
- Embark on new educational journeys based on the content learned.
This lesson demonstrated how data visualization can teach the mathematical concepts behind machine learning and how it can be used not only to describe data but also to make preliminary predictions. While predictions based on visualization aren’t as precise as those derived through mathematical modeling, they can still support effective data storytelling.
In this lesson, you explored the concepts of statistical inference
and regression through data visualization — two foundational processes
in machine learning models. While we didn’t delve deeply into the
mathematical details of these concepts, you learned their underlying
logic and applied it by predicting the happyScore for two
countries not included in the dataset. Additionally, you gained
experience in visualizing scatter plots, bubble charts, and heatmaps
using Python’s Seaborn library.
Understanding the difference between inferential and descriptive statistics, as introduced in this lesson, not only clarifies how machine learning models predict values but also strengthens your data storytelling skills. If you’ve primarily focused on describing existing data in your storytelling, you can now make approximate predictions for values not yet in your dataset based on the available data.
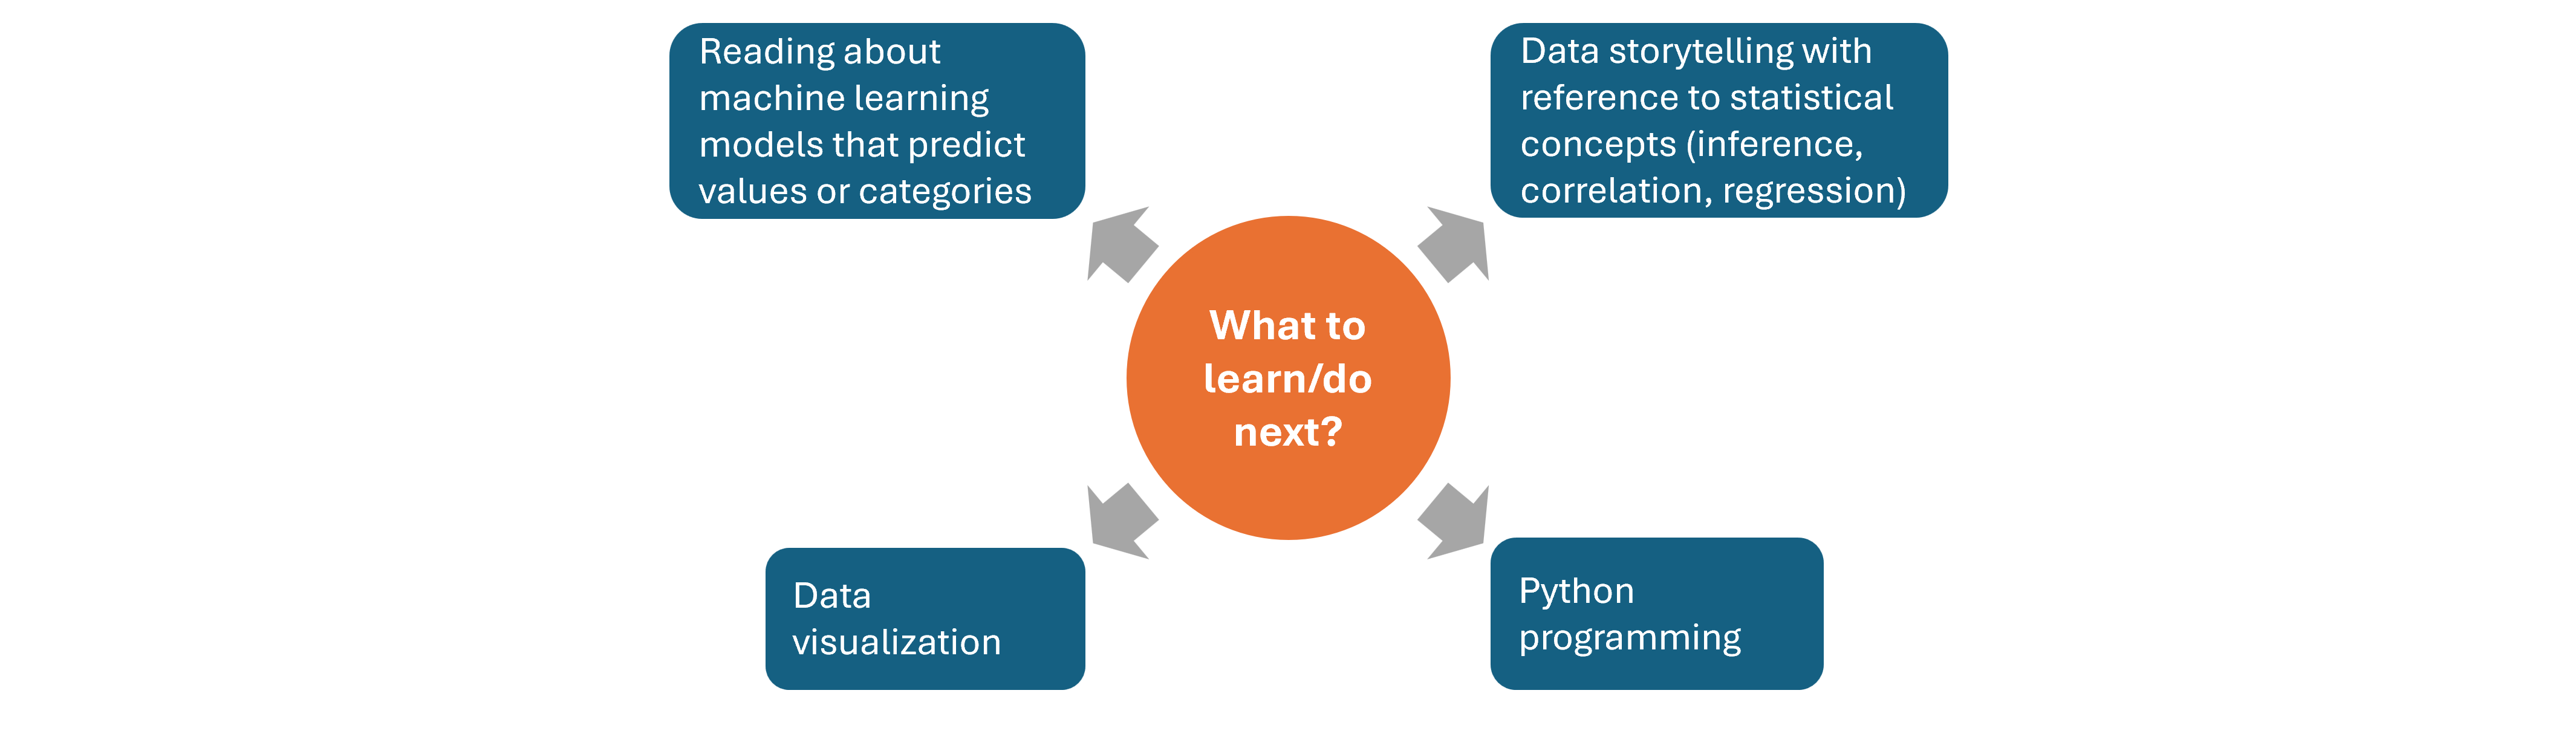
What’s next?
Your next step could involve diving into the mathematical foundations of inferential statistics, including probability distributions, sampling methods, and the central limit theorem, to deepen your understanding of predictive models. You might also explore fundamental machine learning concepts, such as training and testing datasets and algorithms like linear regression and decision trees. Enhancing your Python data visualization skills and refining your approach to data storytelling by combining description and prediction could also be valuable next steps.
- Explore the possibilities of data visualization for statistical inference and storytelling.
- Figure out the next learning steps.